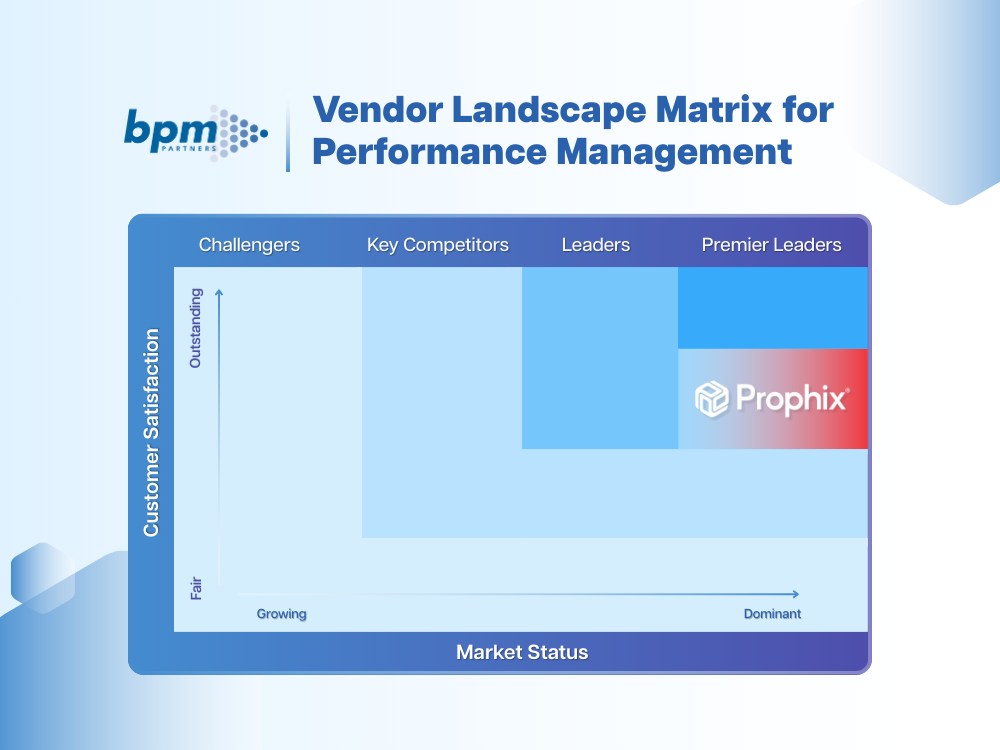
Laden Sie das BPM Partners Whitepaper herunter
From numbers to insights: How variance analysis and performance reporting drive strategic decisions
Learn how variance analysis and performance reporting support smarter strategic decisions.
Juli 17, 2025Let’s be honest…no one got into finance just to move numbers from one spreadsheet to another. The real thrill? Analysis. It’s where magic happens. Performance reporting and variance analysis are like the directors of a great production: not always center stage but absolutely running the show. These are the tools that turn “What happened?” into “Here’s what we do next.”
Whether you’re spotting red flags or green lights, this is where finance gets strategic; decisions get sharper, and the business actually moves. So, let’s talk about the part of accounting that makes things happen.
The role of variance analysis and performance reporting
Performance reporting tracks how your business is performing against financial and operational goals. It gives stakeholders a clear view of results. This could look like a cash flow dashboard that outlines key liquidity metrics and the overall cash position, or an executive summary dashboard that showcases profitability across all regions, or your top revenue-generating customers. But knowing what happened is just the first step.
That’s where variance analysis comes in. It digs deeper into the why behind the numbers, a question you can only really answer if you compare what happened (actual and historical data) to what you thought- or planned- would happen (budget or forecast data). These are the comparisons that reveal whether expectations were unmet, met, or exceeded, and most importantly, why.
Together, performance reporting and variance analysis help companies move from passive observation to active decision-making, whether that’s course correcting, reallocating resources, and identifying new opportunities for growth or investment.
Importance of variance analysis
Variance analysis can be a goldmine in two very distinct ways – it can be your greatest educator on what you’re ‘doing right’, or act as an early warning system to what could be ‘going wrong’. Favorable variances (using revenue as an example) could be a great indicator that a certain marketing campaign or sales strategy works in a given region and could drive decisions on rolling out the same strategy elsewhere.
On the other hand, a missed unfavorable variance, like a recurring overspend on materials, could quietly snowball into major profit leaks if not corrected.
Without scrutinizing favorable or unfavorable variances, companies risk letting over- or under-spending go unnoticed, could allow profit-draining inefficiencies to go unchecked, and could miss opportunities for growth by not having a pulse on what strategies are driving the greatest revenue growth or greatest operational efficiencies from a cost-perspective.
With the right reports, these green or red flags come to light. A sales and expense variance report in retail might reveal a promotional campaign that increased costs but failed to boost sales. A patient revenue report for a clinical healthcare facility could show a drop in reimbursements for a key service line. In manufacturing, a demand variance report might uncover a spike in orders that warrants expanding capacity, while a production variance report could highlight a line outperforming in both speed and quality.
Variance analysis helps companies course-correct or double down on what’s working.
Benefits of conducting variance and performance reporting
Let’s be real, if you’re putting together a budget every year, and even going as far as running forecasts throughout the year, it’s likely you’re already very familiar with performance reporting and variance analysis (otherwise your budget is just a glorified wish list, and not a tool to guide your organization’s future!).
So, let’s now explore what magic can be made with reliable and informative variance analysis: driving business strategy. So, what are the benefits of variance analysis?
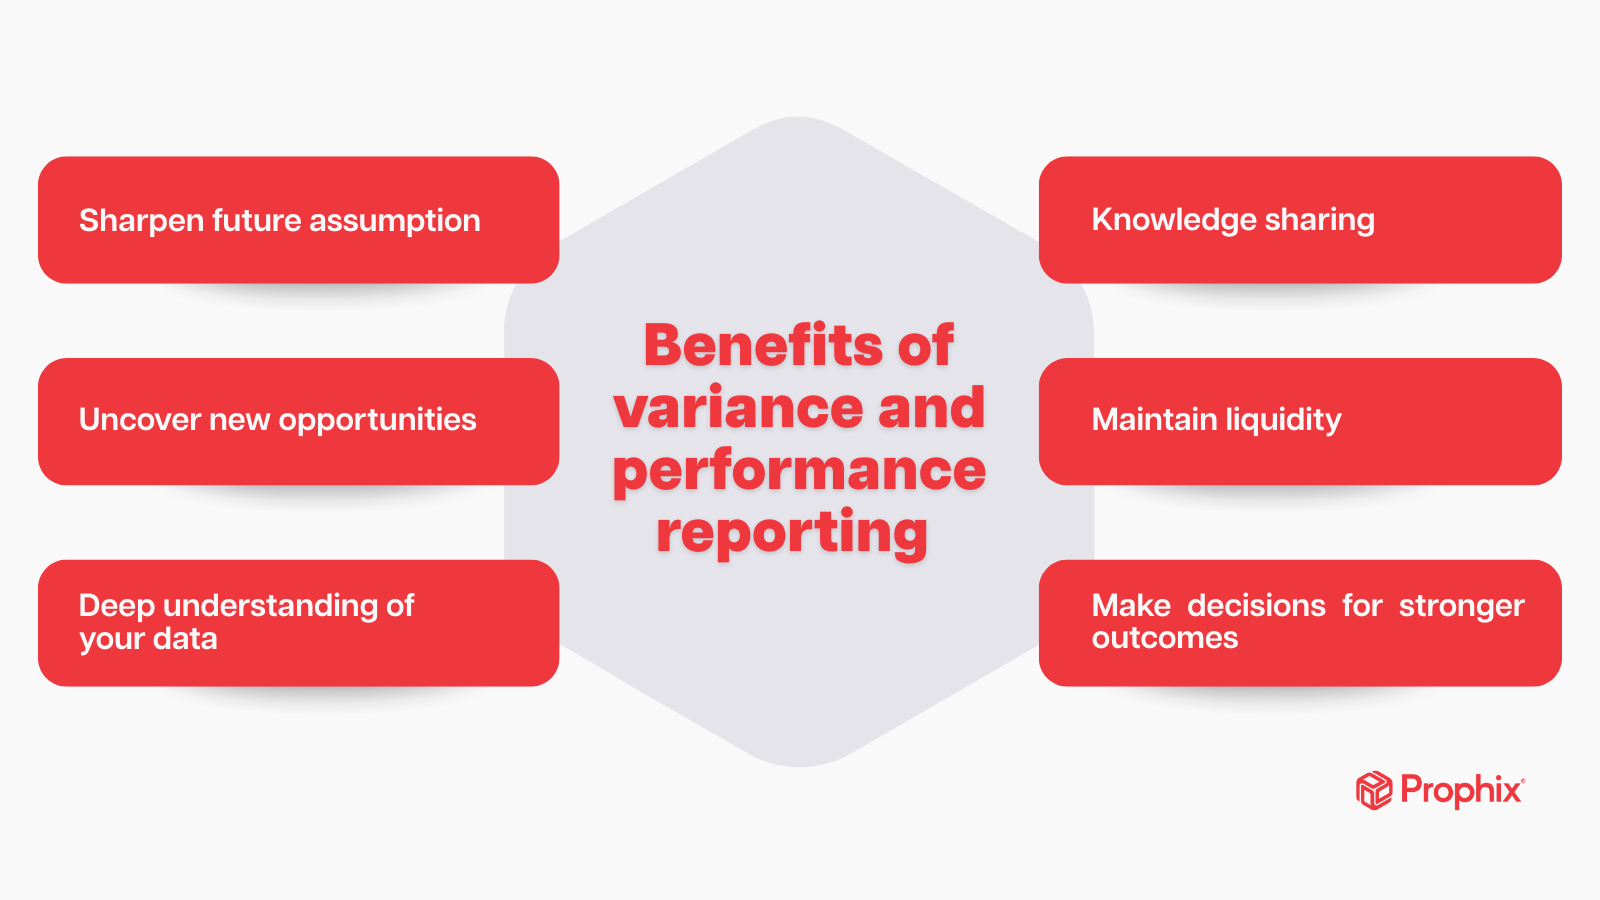
Sharpen budget assumptions for the future: Variance analysis reveals where budget assumptions missed the mark so next year’s plans can be smarter. For example, you may have estimated trade show costs using a flat per-event rate, but in reality, shipping costs doubled, and booth setup fees fluctuated by location. Catching these gaps allows for more precise, data-driven budgeting going forward.
Helps maintain liquidity at favorable levels: Identifying a large negative variance early allows a company to course-correct and re-allocate resources. This could look like postponing the opening of a new retail location or shifting marketing funds into collections efforts to improve cash inflow. This is a necessary hedge against long-term cash flow impact.
Deep understanding of your data: The sheer act of conducting variance analysis requires digging into deeper levels of your data for explanations of what is truly at play. Variance analysis can start at the top level, for example, so you can quickly understand that at the company level, across all geographies, departments, product lines, and more, that gross margin is higher than you planned for. But it’s necessary to look deeper to see what’s under the hood. What if there is a product line or geography that is truly struggling to meet performance, but there are enough high-performing geographies or product lines that balance the scales? Visibility into underperforming areas of the business is key so that the overall margin of the entire company isn’t degraded because of the underperformers.
Knowledge sharing: Let’s say a certain geography had a favorable variance on customer acquisition costs. Other geographies can template the marketing campaigns they run. Or, assuming a favorable variance of a certain store can be attributed to a certain threshold of foot traffic, this information can be leveraged by other stores and geographies to adjust their marketing strategies to increase foot traffic.
Drives decision-making for stronger future outcomes: Variance analysis results in actionable decisions. For example, reviewing and modifying pricing strategies of a good or service, or re-allocating marketing efforts from one place to the next. These strategies can be employed quickly, and results can be tracked over the next several months.
Uncovered opportunities: Variance analysis isn’t only about avoiding pitfalls—it’s also about uncovering opportunities. Favorable variances can reveal high-performing products, unexpectedly strong demand, or operational efficiencies that can be scaled. For example, identifying a cost-saving production tweak in one facility could become a best practice across the company, or discovering a department that consistently beats revenue targets may justify further investment.

How to create an effective performance reporting process
When done well, performance reporting doesn’t just show where a business stands; it fuels smarter forecasting and strategic agility. For many organizations, reporting is still reactive and overly focused on explaining the past rather than planning for the future.
Here’s what you need to know to level-up your performance reporting and pave the way to insight-driven decision-making:
Peel back the layers of your data: The real value of performance reporting lies not in static charts, but in the ability to drill down into the data and uncover the true driver behind the number or variance. When teams can explore metrics at a granular level, such as by product line, region, channel, or driver, they gain the clarity to adjust future forecasts meaningfully.
Establish a single source of truth: When different teams work off different spreadsheets, systems, or definitions, reporting becomes a negotiation rather than a decision-making tool. A single source of truth, ideally via an integrated financial performance platform, ensures that everyone is aligned on the same data.
Foster a culture of analysis: Reporting is only as effective as the people interpreting it. A truly impactful performance management process promotes a culture of analysis, where finance is not the sole owner of insights. Cross-functional collaboration that brings together finance, sales, HR, and operations, helps contextualize variances and ensure that decisions are made with a complete picture in mind. When departments co-own the data, they’re more likely to act on it and stay accountable.
Focus on key performance drivers: Not all variances are created equal. High-performing organizations focus their analysis on the drivers of performance. These might include sales volume, labor utilization, customer churn, pricing strategy, or input costs, depending on the business. For example, if gross margin fluctuates, it’s important to isolate whether the root cause is product mix, supplier costs, or pricing. Isolating the root cause keeps reporting actionable.
Avoid common pitfalls in analysis: Performance reporting can suffer due to common issues like poor data quality, which leads to misleading variances, stale assumptions that no longer reflect business realities, or timing mismatches and seasonal effects can distort results if not adjusted for. Teams may also waste effort on immaterial variances or misidentify root causes, fixing the wrong problems. It’s good to be aware of these common pitfalls and work on avoiding them to keep your analysis accurate, focused, and decision-ready.
Drive clarity and action with your reporting
Raw numbers are like raw ingredients—boring on their own. But add the right tools and timing? You’re cooking up insights that fuel the entire business. Performance reporting and variance analysis are your recipe for turning financial noise into strategy. With the right technology, culture, and discipline, reporting can become a launch-point for faster decision-making, better forecasting, and more accountable teams.
If you’re rethinking your performance reporting, start by asking: Does our reporting drive clarity and action? If not, it’s time to evolve. Start exploring the unique ways that companies use Prophix One, a Financial Performance Platform, for their performance reporting and variance analysis.
Einblicke für die nächsten Finanzführer
Bleiben Sie mit umsetzbaren Finanzstrategien, Tipps, Nachrichten und Trends einen Schritt voraus.


